8 Tools To Make You Faster in Google Analytics

We know you. You love analytics. You love the graphs and charts and statistics. But often too much of our time in Google Analytics is spent pulling up reports, debugging and testing implementations.
The following are some browser tools and Google Analytics features that will save you time when reporting, troubleshooting, auditing and testing GA implementations. After all, the less time we spend doing this stuff, the more time we’ll have to spend on what’s really important: analyzing data and taking action.
Keyboard Shortcuts

Instead of opening the Date Range box every time you need to set up a time frame, use the Date Range Keyboard Shortcuts to set up the date ranges that we (web analysts) use the most: today (dt), yesterday (dy), last week (dw) and last month (dm).
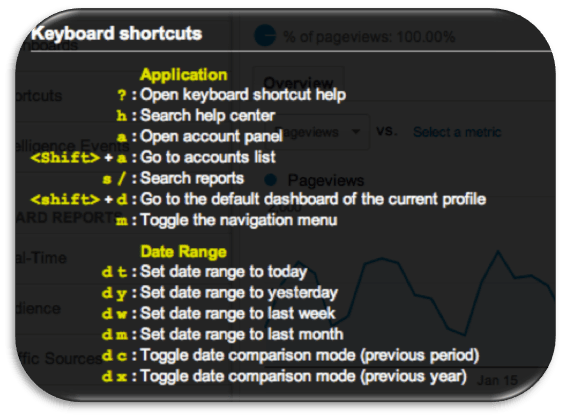
Regarding date comparisons, Google Analytics launched in late 2012 a ‘Compare to’ function on the Date Range box, where you can choose to compare to Previous Period, Previous Year, or to a Custom date range. Even though this made comparisons quick, I recommend using Date Range keyboard Shortcuts as it makes it even quicker. For example, to compare March 2013 month over month and year over year, all you need to do is:
- Hit dm to set the date range to March 2013
- Hit dc to compare to previous period
- Hit dx to compare to previous year
See? Much quicker than opening the Date Range box to set 1 & 2, hitting Apply and then going back to the Date Range box to set 3 and hitting apply.
Report Shortcuts
If there are reports you visit periodically that require some sort of customization, you can start using Shortcuts to save time.
To give an example, I frequently had to visit a certain report, and to do so, I had to get to the Paid Search report (a couple of clicks), then go to the Ecommerce Tab, set Source as the Primary dimension, then set Campaign as the secondary dimension, and then change Show Rows to be able to see all of the rows available. Finally, I could hit Export to manipulate the data in Excel.
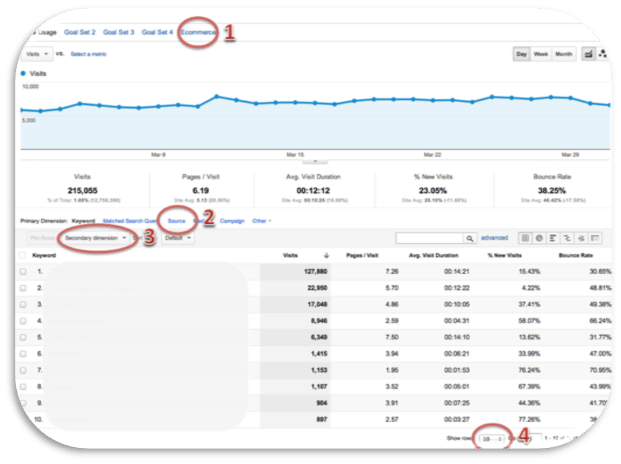
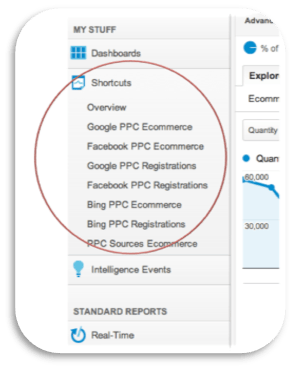
However, it’s possible to set the customized report to be readily available as a Shortcut on the Home tab. So the next time you need to navigate to it, you won’t have to take all the above-mentioned steps; you’ll only have to click on Shortcuts to access it and it will have the exact configuration you needed.
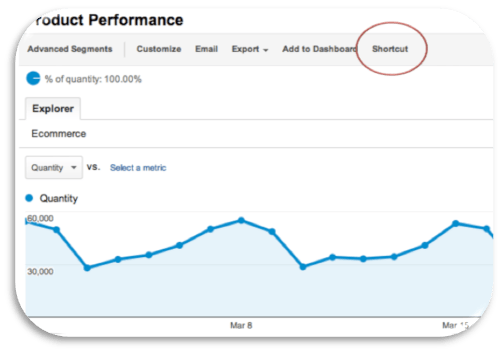
To set a report to be available as a Shortcut, simply configure the report just as you need it (advanced segments, sorting, primary/secondary dimensions, show rows etc.), hit the Shortcut link on the top navigation and name the Shortcut. The report will be available every time you access the profile on the Shortcuts list (however, it is only visible to the user that created it).
Custom Reports
Custom reports are a great way to save time if you know the data you want to focus on and the key performance indicators that fit your business goals. With custom reports, you can create reports with exactly the dimensions and metrics you need by accessing the Customization feature.

To make it easier and more straightforward for users to create custom reports, last month Google Analytics launched a feature with the possibility to customize a standard report or, in other words, create a custom report by editing the configuration of the standard report (add or delete metrics, groups of metrics, dimension drilldowns and filters).

When using custom reports, however, beware of sampling. When you request a custom report from Google Analytics, you are requesting an ad hoc query (requests outside of the standard, pre-aggregated reports). In these cases, Google has to go back to the raw data to process it. If visits within that data range exceed 500,000, GA will take a daily random sample that adds up to 500,000. Additionally, it will process a maximum of 1,000,000 unique dimension combinations for any type of query. For big accounts, these limits can be reached quickly and you can end up with reports based on as little as 3% of your data.
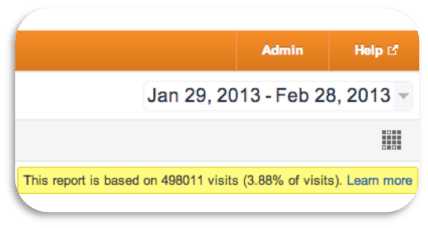
To avoid this, try reducing the date range (for example, run weekly reports and then aggregate them externally to get a monthly report), reducing the number of metrics and avoiding the application of secondary dimensions. If sampling is still an issue, then you are better off looking at multiple standard reports and using Shortcuts, rather than creating a custom report.
Dashboards
Dashboards are also a great tool to quickly monitor your business KPIs and online marketing efforts. With Google Analytics, you can build up to 20 dashboards per profile with up to 12 widgets per dashboard. This month, Google Analytics launched Real Time Widgets, so now widgets that are part of your dashboard can have real time information.
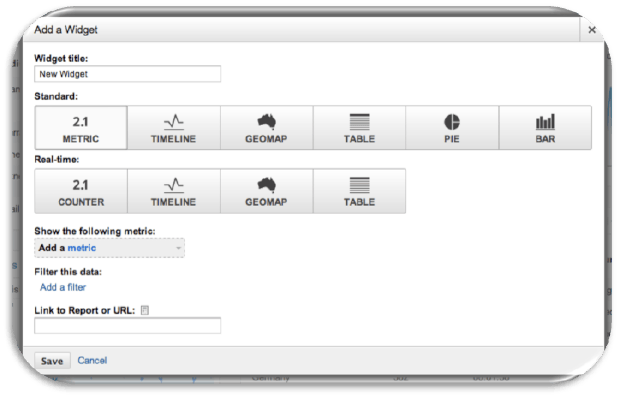
If you aren't sure about the information you should be setting up on your dashboard, or if you want to get new widget ideas, I recommend the Google Analytics solution gallery. It's a great place to find useful dashboards (it also provides great custom reports and advanced segments) according to your business and the SEM effort you want to monitor. You'll be able to download the dashboard you want to try and immediately import it into your Google Analytics account! How great is that?!
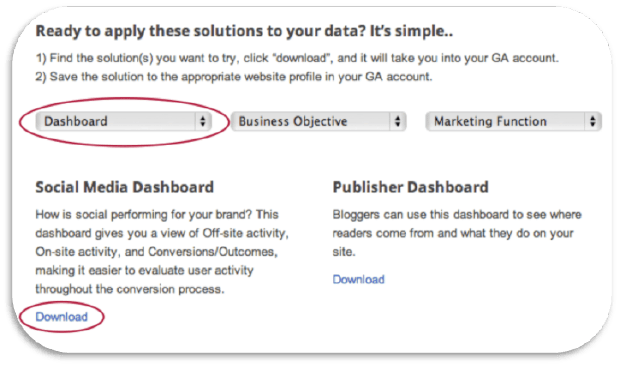
The list of available dashboards, advanced segments and custom reports is always growing, so I recommend you visit it frequently.
Tag Assistant (Chrome)
When troubleshooting or auditing implementations, instead of going through the Page Source View to look for tags on a page, use this Chrome tool. To use it, just navigate to the page you want to evaluate and click on the Tag Assistant icon.
This tool will save you time as it lets you know the Google Analytics, Google AdWords (conversion and remarketing tags), Google Tag Manager and DoubleClick Floodlight tags that the page has. It will also evaluate each tag and determine if it is working (coded as green), if the tag can be improved and how (coded as blue), if there are minor or critical implementation issues with the tag (yellow and red respectively), or if there are no tags on the page (the Google Assistant icon appears grey and displays an X).
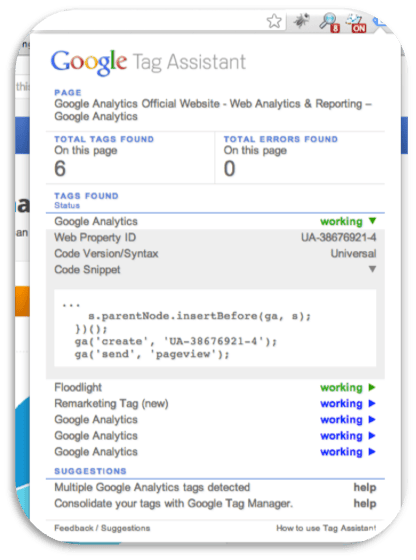
By clicking on a specific tag, you’ll see more useful details. For a Google Analytics tag, for example, you’ll see the web property ID (UA-#), the code version that is being used and if there are any improvements that can be made (if the code is on the incorrect place or if there are any deprecated methods being used, for example). You can also click to see the code snippet.
Google Analytics Debug Tool (Chrome)
When troubleshooting, auditing and testing Google Analytics implementations, use this Chrome tool. Turn the tool on by clicking on the envelope icon.
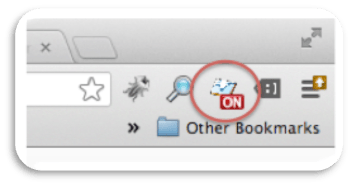
Open the console by hitting Command+Option+J for Macs or Control-Shift-J for computers running on Windows. Refresh the page you want to evaluate
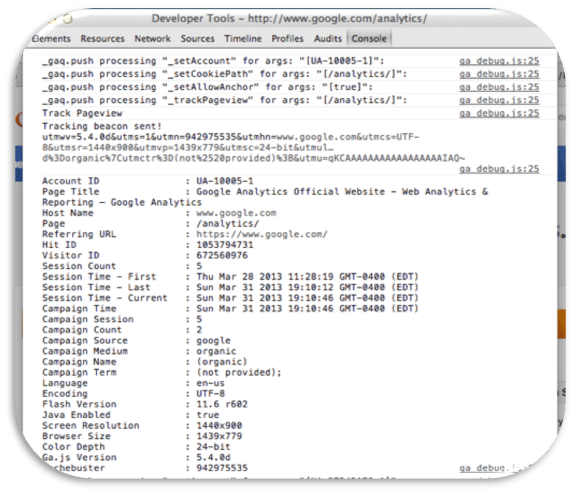
The console tab will show you what information is being sent to Google Analytics once someone hits a specific page on your website. Therefore, this tool provides a quick and reliable way to test Google Analytics implementations without having to wait for the data to appear on the Google Analytics user interface.
You can immediately see if the tracking snippet is working, if campaigns are properly tagged, if ecommerce tracking is set up properly and sending the correct transaction information, if onClick events are firing when they are supposed to and if cross-domain tracking is working and sharing cookie information across domains/subdomains, for example.
Search & Recently Viewed Reports
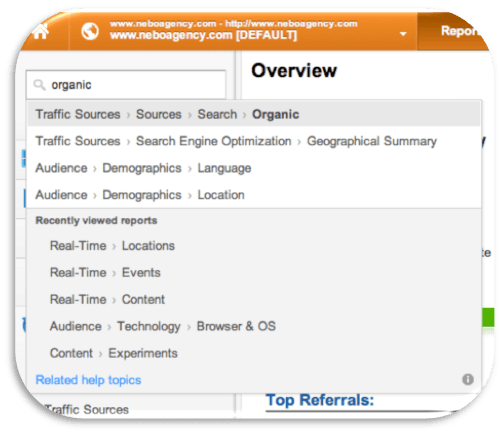
To save time (if you need to get to the Organic traffic report, for example), instead of going to Traffic Sources-> Sources-> Search-> Organic, you can simply use the search box located at the top of the left navigation bar to quickly access this report. By clicking on the search box, Google will also display a list of recently viewed reports.
Recent Profiles
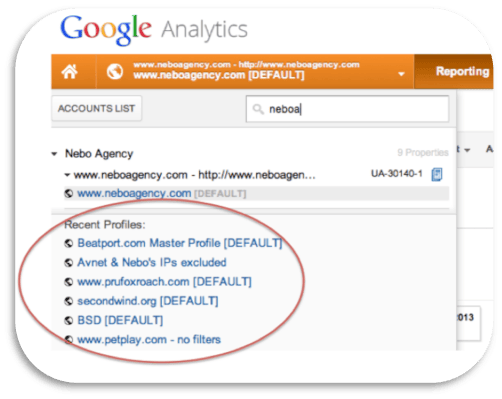
Instead of having to go through the account list to find a client and then finding the correct profile to open, look at the bottom of the account panel where you’ll now find quick links to the profiles that you recently viewed.
Becoming fast takes time, but hopefully you were able to learn some new techniques to help you along the way. There is always room for improvement in analytics, and being more efficient with your time is easy with the tools available to you today.
Comments
Add A CommentWow, I've been using GA since 2006 and I've never seen these keyboard shortucts! And I thought I was a pro... DC and DX are totally going to save me some time because most data-based conclusions are useless the context these comparisons give you.... Thank you Tatiana!
Glad i found these..I've been using google analytics for years and did not know the keyboards:
DM, DC, DX are very helpful...Thanks!
Michael, thanks for the comment. It's a great tool & I'm a loyal user myself! As I mentioned, I think Google has done a great job at sharing some awesome custom reports on their Solutions Gallery page (http://www.google.com/analytics/learn/solutions-gallery.html), so check it out!
This is great, guys - thanks! I love the custom reports tool. I have almost exclusively used them and not the general reports GA typically spits out.